
Microsoft Sentinel incident list in Teams
A live view of Microsoft Sentinel incidents directly in Microsoft Teams? Its possible and as I’ve implemented this a few times recently, I wanted to share my solution with the community.

What we are building here is a Sharepoint list embedded inside Teams, that shows New and Active incidents in a Microsoft Sentinel workspace.

In the end it is not really a very complex thing, but explaining everything will need a long article, so bear with me. ☺️
Here is a quick explanation of the components and data flow:

Simple stuff, but for many this can be useful for a variety of reasons. Maybe you don’t have a proper ticketing system or ITSM tool, or maybe Teams is just so central to your security analyst workflow that this is just a useful add-on to your toolkit.
This may also be useful for incident metrics and reporting, as it is very easy to connect to a Sharepoint list from PowerBI!
Resources needed to deploy this are public in my repository. You are free to use and modify this to your liking, and I am available for individual engagements if you want help deploying and modifying this. 👍
Next I will explain how to deploy the solution.
Create the Sharepoint list
First download my CSV template from the repository. This contains the schema for our list so that later the Logic App can input data in the correct places.
Open the Sharepoint site linked to your Teams and create a new list:

Select From CSV and upload the downloaded template when asked:

Give your list a name like Security Incidents (this will be visible in Teams).
You will end up with an empty list which displays all the columns I’ve chosen to include for Incident data. Full list of columns is here:

It is a good idea to customise the default view so that later your Teams dashboard will only show the columns that are useful to your users. You can do this now or wait until you have actual incidents to show.
Click All items and Add or remove fields to start:

For example, if you only use Sentinel portal, you can disable UnifiedUrl and ProviderIncidentId. Alerts column is a good idea to remove from the default view.
Choose your columns and sort them to your liking. I like to have CreatedTime as first column and use that to sort the list by newest incident.
Click All items and Save the new view with a name like “Main view”. Click your new view and select Set current view as default.
Next we need to make sure we have an Entra user that can access the list. This will be used to write to the list from Logic App. I set the user to Member role inside Teams, but you can use Sharepoint access configuration too if you want.
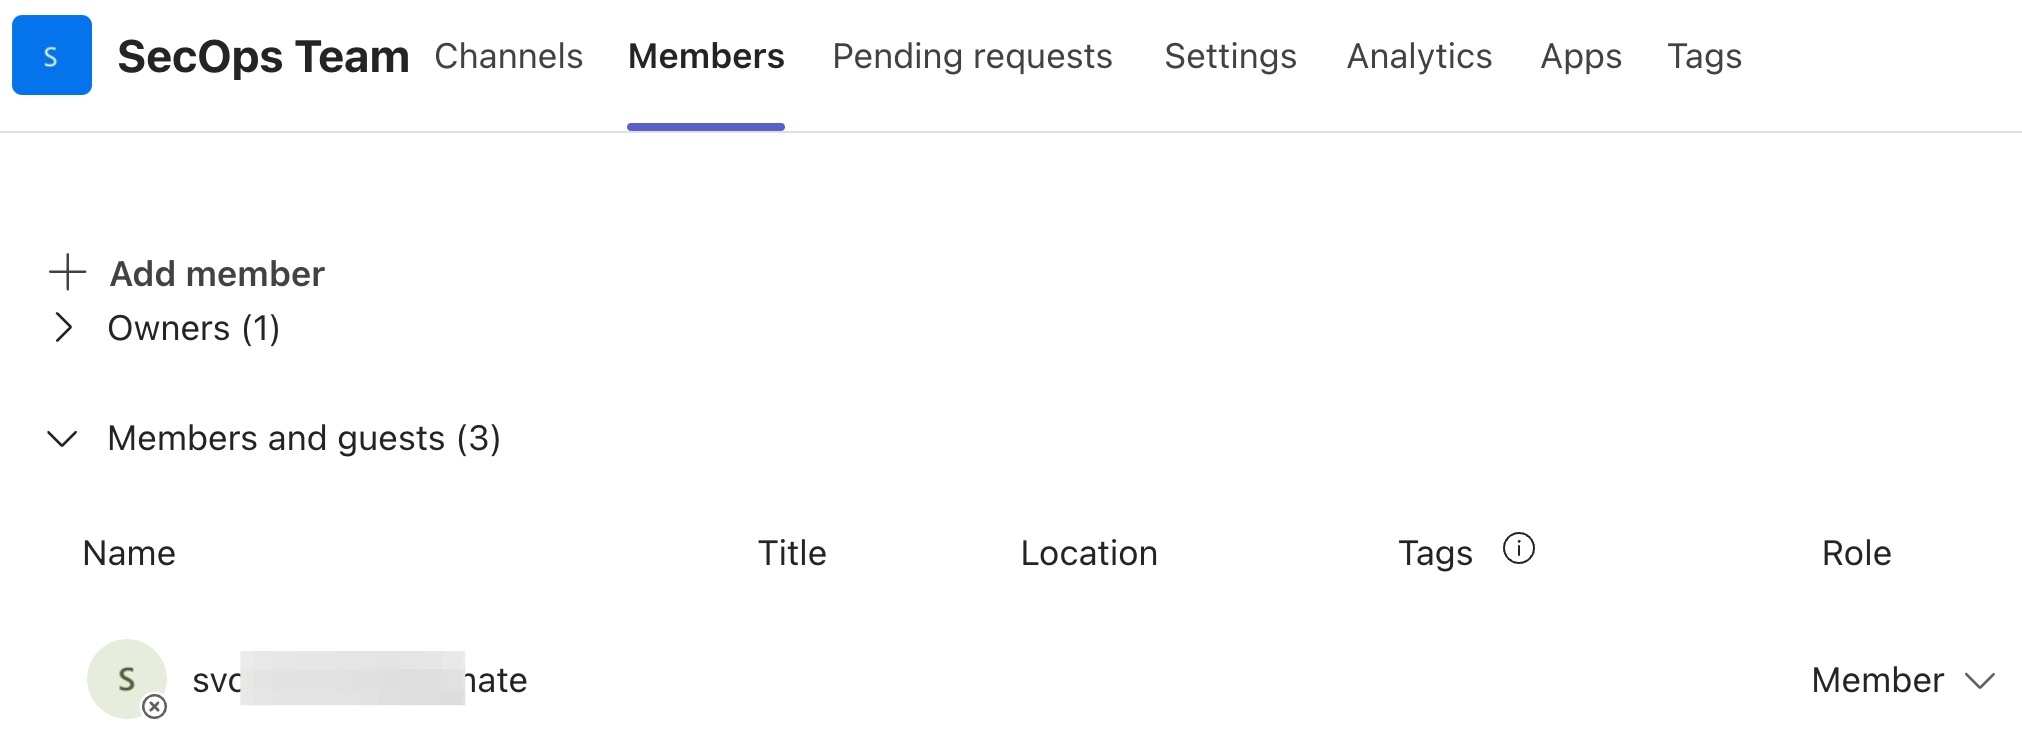
(Microsoft Online integrations with the native Logic App actions can’t use Managed Identities, so we need a normal account, either a human user or service account.)
⚠️ Keep incident confidentiality in mind. We are extending access to our incident data outside of Sentinel workspace access controls. Make sure you are allowed to show this data to your Teams team members.
Create the Teams view
To get the list visible in teams, open your Teams channel, add a Lists tab and choose your list:
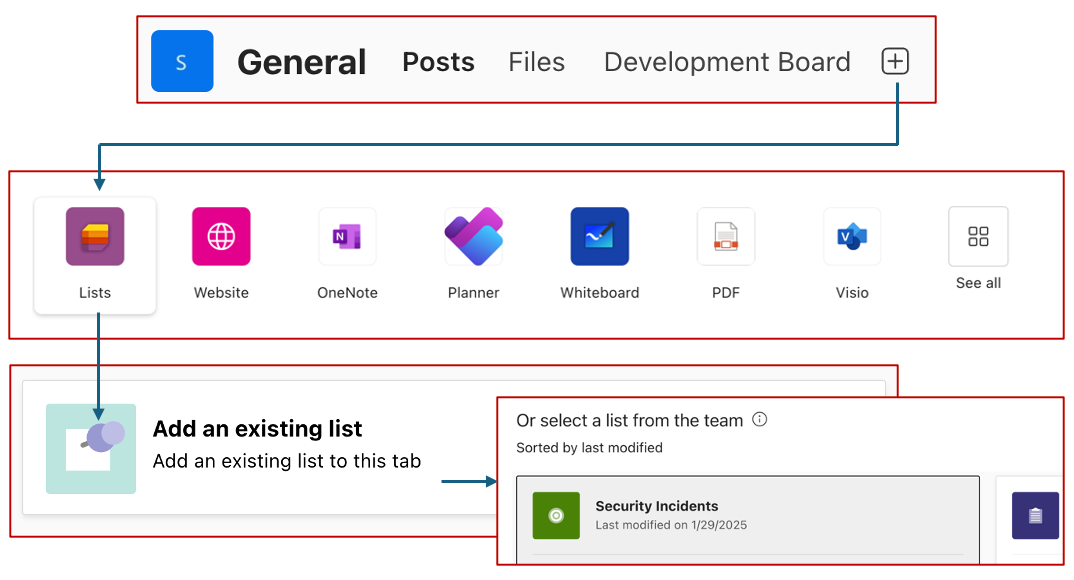
Now we are ready to write data to our list.
Deploy Azure resources
To deploy the Logic App to Azure you can use the Deploy to Azure button in the GitHub repository.

During the deployment you must set Playbook name, Sharepoint List Url and Sharepoint List Name parameters to match your environment:

The deployment creates three Azure resources:

To ensure the Sharepoint Online API Connection works, you have to open the connection resource and authorise the connection in Edit API connection:

Click Authorize and sign in with the user you granted access to Teams earlier.
To get the Microsoft Sentinel connection working, you need to add Microsoft Sentinel Reader role assignment to the Logic App’s Managed Identity in your Sentinel resource group:

Next we need to create our Sentinel Automation rules.
There are two rules, one for new incidents and one for updated incidents.

You can deploy both of these from the repository in a single deployment:

For this deployment you need to set three parameters: Resource group of Sentinel workspace, Sentinel workspace name, Entra tenant id, full Logic App Resource ID.
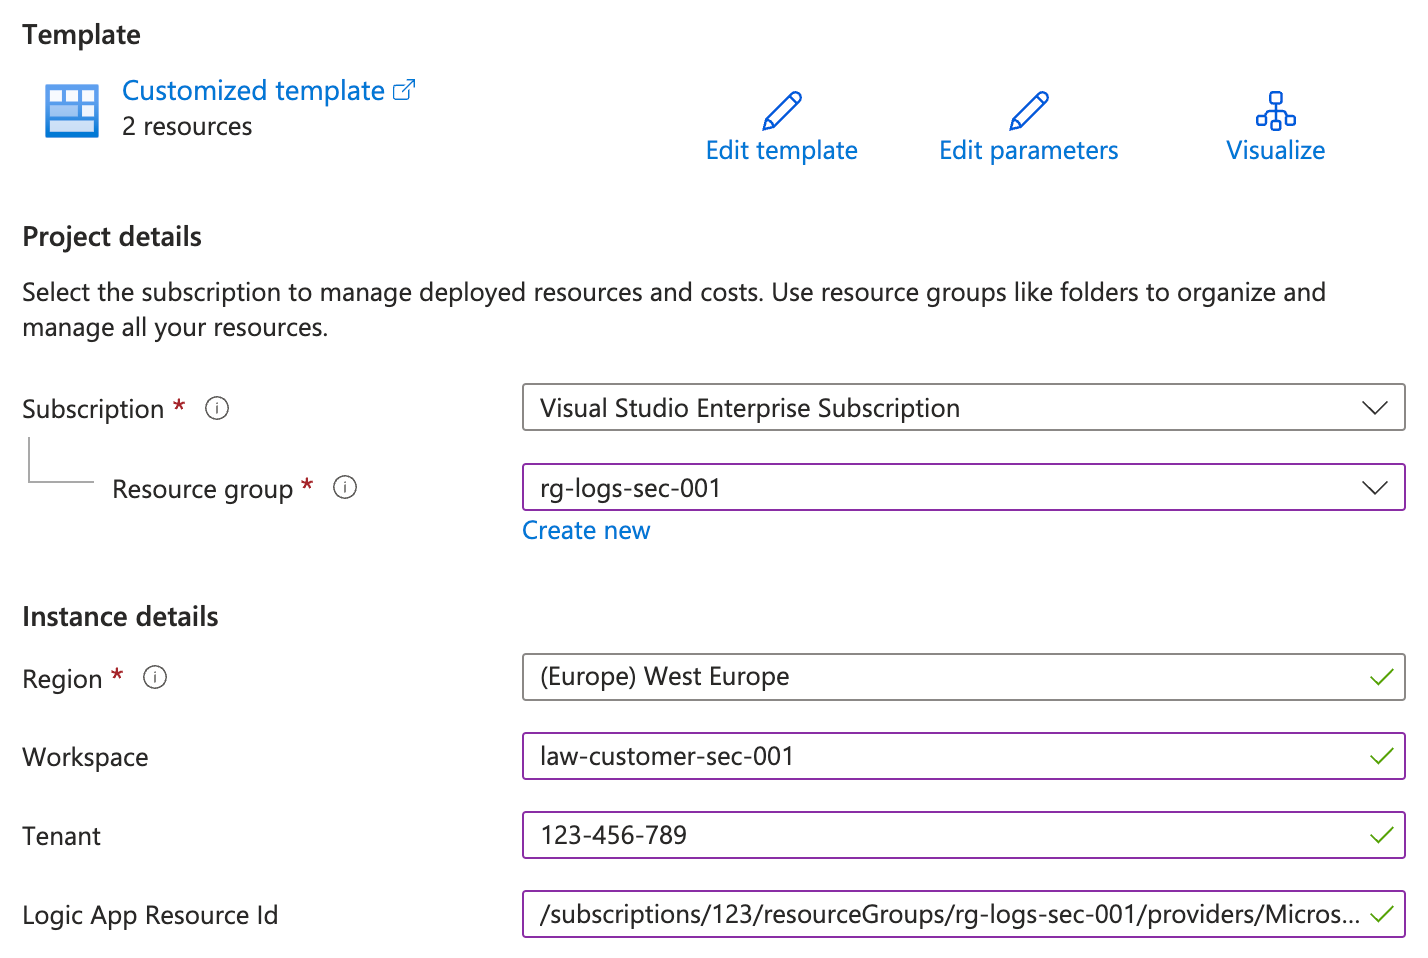
The Resource ID can be found from Logic App resource → JSON View.

After deployment configure your automation rule order to suit your environment.
Test it out
Now we should have everything in working order, and as soon as you have new or updated Sentinel incidents, the Sharepoint list and Teams dashboard should populate.
At this point you likely have both new, active and closed incidents visible. Likely you want to click Status column and Filter by New and Active to get rid of closed incidents in this view. Then save the default view again and you are good to go.

If you click the Title of an incident, you can see all collected incident attributes, including individual alerts:

There we go, hopefully this is useful to you!
There are many ways to customise the list and the collected data. You are free to use and modify this. Code view will work better in Logic App designer.
I am available for individual engagements if you want help deploying and modifying this. 👍
this is really good. Can I pull incidents from the Defender Portal?
everything is done except role assignment, can you please help us?