Shodan Monitor alerts to Microsoft Sentinel
Shodan Monitor is a service for Shodan subscribers that can detect the following issues in publicly available networks and hosts:
Services associated with ICS or IoT devices
Compromised or malware-related services
New open ports, uncommon open ports
Open databases
Known vulnerabilities
Expired certificates
In brief it is a method of managing public attack surface, usually for your own assets.
Shodan Monitor has a Notification service that can send these alerts via email, instant messaging or a Notification Webhook.
Solution overview
This solution provides an Azure Logic App playbook for ingesting Shodan Monitor alerts to Microsoft Sentinel for alerting and hunting.
The Logic App triggers when Shodan Monitor sends an alert HTTP request, parses the recieved data and stores selected fields in Log Analytics workspace.
Here is a visualization from the playbook in Logic App designer:
Deploying the solution
The Logic App code is located in GitHub repository mikoiv/MicrosoftSentinel-ShodanMonitor and can be deployed from a template to your Azure environment:
When deploying the template you have the following parameters to configure:
Resource Group Resource group for deployed resources
Region Azure region for deployed resources
Playbook Name Logic App name (default: ShodanMonitor-Sentinel)
Log Analytics Connection Name API connection name (default: loganalyticsconnection-ShodanMonitor-Sentinel)
Log Analytics Workspace ID Enter the unique ID of your Azure Log Analytics workspace
Log Analytics Workspace Key Enter the primary or secondary key of your Azure Log Analytics workspace
After finishing the deployment, you need to open the Logic App and copy the unique listener URL from the first action:
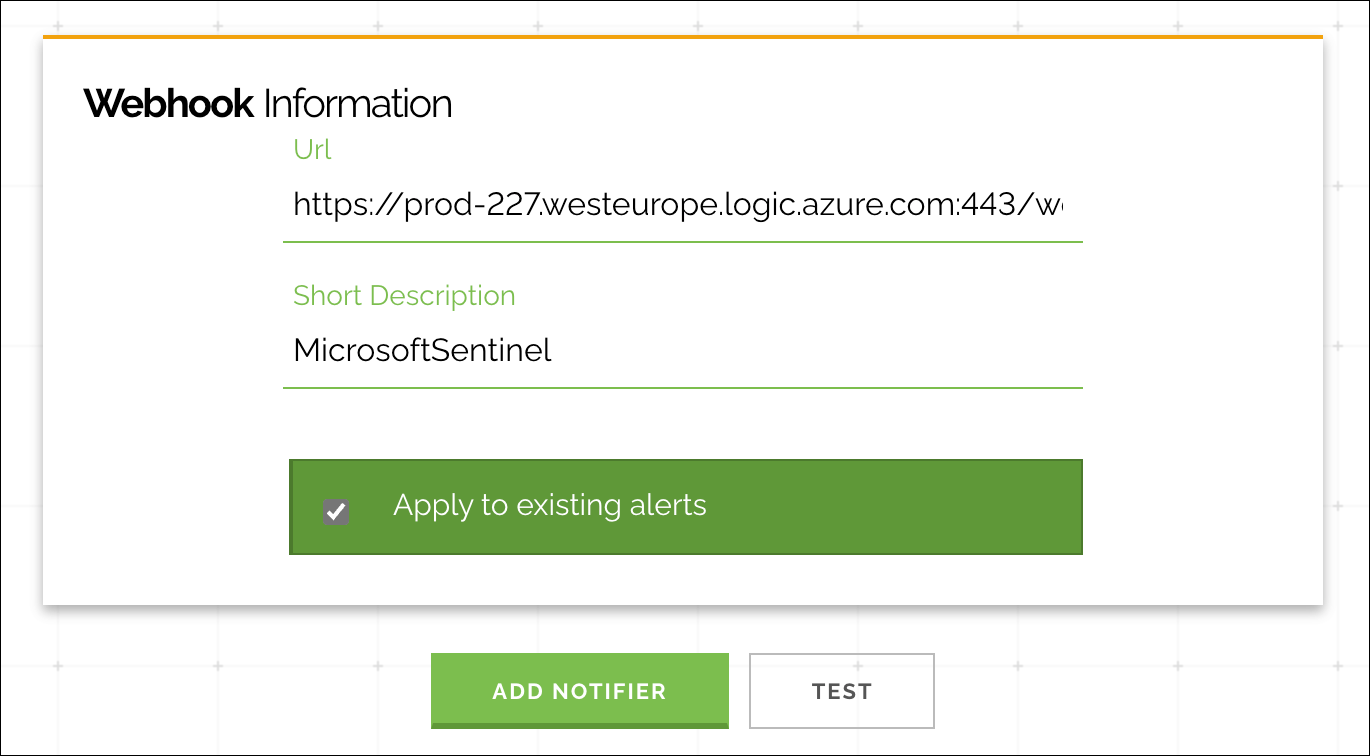
Now you can create a new Notification Webhook in Shodan Monitor configuration:
Depending on your assets and environment you will start getting new alerts sooner or later. A good way to test is to add new networks that you know will generate findings.
Make sure you transfer and the URL securely. The Logic App does not have actual authentication, just a check that a Shodan HTTP header exists in incoming requests.
Results in Sentinel
At the moment the solution gathers the following data:
SHODAN-ALERT-ID, SHODAN-ALERT-TRIGGER (Alert metadata)
Timestamp, Module, IP address, Port, Transport protocol, Organization, Country (Related data from Shodan database)
Here is a screenshot of the current data model in Azure Sentinel:
From here you can build your own use cases for correlating, alerting or hunting for things related to your public security posture and attack surface in Microsoft Sentinel.
Last notes
Shodan Monitor can be a bit noisy. If you build scheduled alerting based on the data, it will be a good idea to suppress repeated alerts. Shodan provides a method for this but it is not very obvious: you need to enable e-mail alerts and look for the suppression URL format from an alert recieved by mail.


